Hello, In this technical blog, we will explore the use of R for fleet mobility analytics. This case study is based on a project that was undertaken for a transportation company with a fleet of 102 trucks and 91 drivers. The objective of the project was to develop a real-time tracking tool for the moving resources.
Originally, the first thought of some of you is: why R was chosen as the programming language for this software? First because I have been learning R at that time besides data science; this project was relying mainly on Preparing and visualizing data from different sources, and R is good at this. Secondly, because of its versatility and power as an end-to-end dashboard by using RShiny.
The resulting application is web-based, allowing authenticated users to visually control the moving assets of the company. It is intended to reduce the time required for requests, increase the reliability of communication, and provide alerts in a visual format.
Context
The process of developing the application began by understanding the business needs and workflow of the company, as well as the challenges faced by the users.
The data was then prepared and valuable datasets were identified. R Shiny was used to develop the web-based application, which was connected to the APIs of CAN-Bus to customize the experience.
The application was designed to be easy to use and interactive. data processing, ingestion, and visualization were completely automated.
Fleet tracking app
The main mission was to implement the fleet tracking app, which will be the center of most of the fleet operations, building a successful product starts with understanding the business objectives and how the company expects to use and benefit from the model.
Specifications
Before developing a fleet management model, it is important to To effectively meet the needs of all stakeholders, including dispatchers, operators, and management, it is important to understand their expectations and challenges. These individuals use the fleet management platform on a daily basis and collaborate with many drivers and clients, so it is important that the platform is user-friendly and meets their specific needs to avoid unnecessary stress.
Some of the key needs from the fleet management system include:
- Organizing the fleet and improving its overall efficiency, by using a centralized solution.
- Tracking the performance of the fleet, including metrics such as fuel consumption, utilization rate, and maintenance needs.
- Identifying and reducing waste in the transportation process, such as unnecessary vehicle idle time and inefficient routes.
Actions
To develop the fleet tracking solution, the following steps were taken:
- Gathered input from stakeholders to understand their challenges and needs, to write the technical specifications document.
- Researched the best features and techniques to include in the solution.
- Develop a web-based application, connecting with the APIs of Can-bus to customize the experience. Used
RShinyas a framework. - Identified valuable data sources, and built the data preparation functions, automating the process.
- Evaluated the business workflow to ensure that the solution would be well-suited to the needs of the users.
- Designed the UI to be easy to use and interactive.
- Deployed the solution as a web-based application, Hosted using
Dockeron a web server.
Data processing
To prepare the data for the fleet management solution, the following steps were taken:
- Data sources: Defined points of interest using latitude and longitude coordinates
- Created geofencing zones to define specific areas of interest.
- Organized the master data of resources, including drivers, trucks, trailers, and points of interest.
Results
As a result of the fleet tracking project, the following benefits were achieved:
- The application is centralizing all the fleet operations, the web app allows authenticated users to visually control the movement of the company’s assets. Alerts are visualized on the map, eliminating the need for tables.
- The time required for requests was significantly reduced, since all the data processing is automated.
- Collaboration within the team has been improved, increasing the reliability of communication.
Overall, the project was successful in meeting the needs of the transportation company, and the application has helped to improve the efficiency and effectiveness of the fleet management system.
Spatial map
Below, you can interact with the map layers. Please note that the content is in French, but the meanings of the items will be explained.
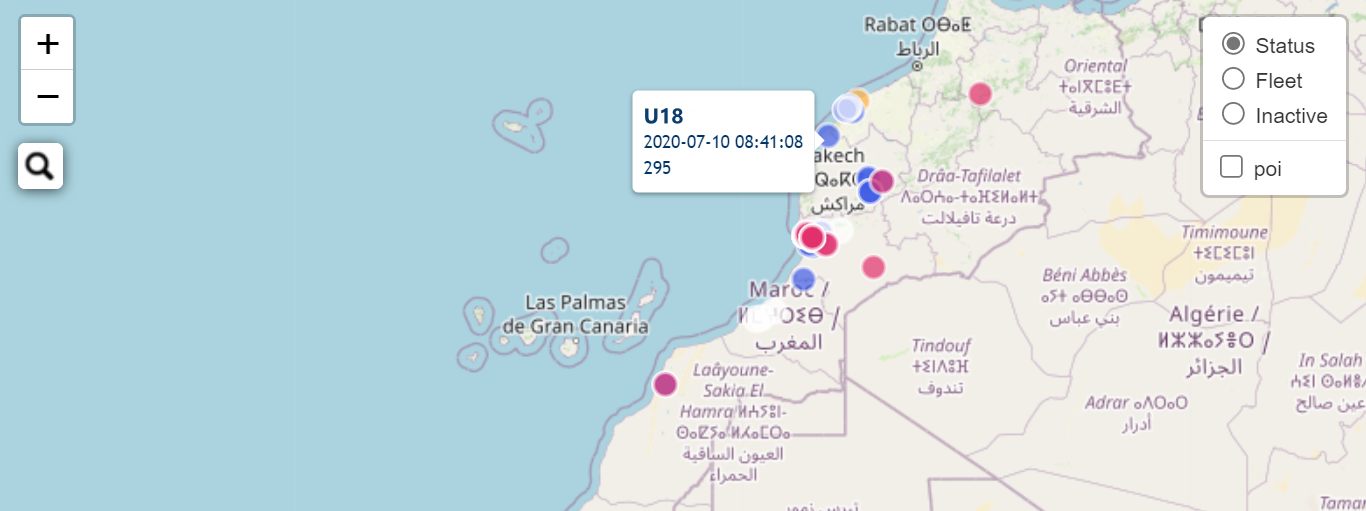
Four Layers:
The following table describes the different layers available on the map:
| Layer | Description |
|---|---|
Activity | Shows items by type of activity |
Fleet | Shows clusters of vehicles, useful for seeing how many vehicles are in a particular geographical zone |
Inactive | Shows inactive units, making it easy to identify idle ones |
p.o.i | Shows the location of points of interest |
Thank you for reaching out to the end of this article, and feel free to suggest any update to it.
Optimizing the tasks assignment to trucks
Reporting the metrics
Thank you for reading this article. Feel free to add a comment, bests.